Code Browser for C, C++, Rust & Dart by KDAB
codebrowser.dev (formerly code.woboq.org) is provided to the community by KDAB. Read more here
This is an online C, C++, Rust & Dart code browser. It focuses on improving the code navigation with proper semantic highlighting and tooltips.
- Take the feature tour.
- Enable faster understanding of code.
Browse Open Source Projects
C/C++
Qt5 | Qt6 | GLibc | LLVM | Boost | GCC | Linux | GTK | KDE | Dart SDK | Flutter Engine | ImGui | OpenCV | QuantLib
Rust
Dart
Interactive Live Demo
Feature Tour
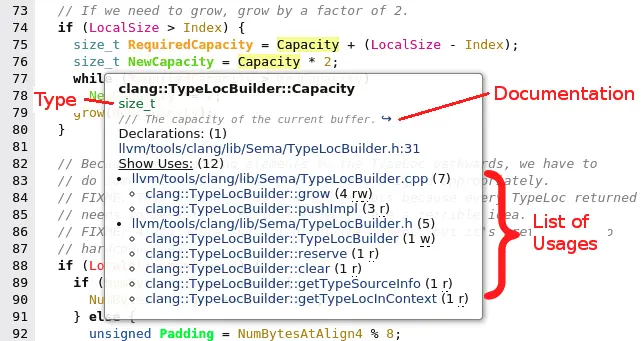
Tooltip containing all useful information about symbols
The Code Browser can be used as a Cross Referencer for C, C++, Dart & Rust code.
Hover over a symbol, and you can see its type, its documentation or where it is used.

Click on the "Show Uses" label to see the list of usages. You can visit each links to discover how it is used. (Hint: you can open them in different tabs.)
In the parentheses you can see the number of uses within each functions. And the letters inside the parentheses are telling how the variable is used:
- r: The variable is read.
- w: The variable is writen.
- c: The function or functor is called.
- a: The address of the variable or function is taken. For Qt signal or slots, this means a connection with them is made.
- m: A member of this object is accessed.
The function signature contains the name of all the argument (useful
to know what 'false, true' means), in
addition to the type of each argument and their default value if
any.
For virtual functions, you can quickly go to the implementation of the
inherited functions

For enum constant you can see the numerical value.
The sizeof is also displayed
Navigation between functions
Clicking on a function brings you directly to the implementation. Just like normal URL, you can open it in a tab or new window and use the back button of your browser to come back where you came from.
Clicking on a variable brings you to the declaration of this variable
Macro expansions

The tool-tip of a macro shows its expansion.
Click on a macro to go to the corresponding #define.
Context
Sometimes, when you are reading the code of a long functions, you may wonder in which function you actually are. You can see the current function in the footer.

Qt support
The Qt SIGNAL and SLOT macros are well
supported. The tooltip of a signal show where you connect to it or
emit it.

Search for a file or for a function
Start typing the name of a file or the name of a function in the line edit at the top. Result will be auto-completed once you entered 4 characters. Jump directly to the file or that function.

Works also on the main page in codebrowser.dev
Show inheritance diagram

From the tooltip you can access a 🔗 symbol detail page which shows the inheritance diagram of a class
Pre-processor

Clicking on an include brings you to that file
The tooltip of an
#if/#elif/#else/#ifdef/#endif directives lets you jump to
the matching directives
Usable links
Link to specific line numbers or to specific function or class within a page to show the code to people on a chat or web page.
Toggle line number

If you wish to copy-paste code, you may want to hide the line numbers. Just click on the link to hide them or show them again.
Semantic Coloration - Pick Your Theme

Semantic highlighting makes reading a piece of code easier as it helps differentiating what is what. You can quickly differentiate local variables from member variables or global variables. Virtual functions are in italic. You can see what is a macros, a typedef, or a type.


Different themes are available depending on your taste. Just pick one from the style combo box at the top right.
Source code
If you are interested in the implementation, you can browse the sources of the generator using the Code Browser itself. Or clone the repository from github. You can report issues on the github bugtracker.
