| 1 | #![warn (missing_docs)] |
| 2 | #![allow (clippy::type_complexity)] |
|---|
| 3 | #![cfg_attr (doc_cfg, feature(doc_cfg))] |
|---|
| 4 | /*! |
|---|
| 5 | |
|---|
| 6 | # Plotters - A Rust drawing library focusing on data plotting for both WASM and native applications 🦀📈🚀 |
|---|
| 7 | |
|---|
| 8 | <a href="https://crates.io/crates/plotters"> |
|---|
| 9 | <img style="display: inline!important" src="https://img.shields.io/crates/v/plotters.svg"></img> |
|---|
| 10 | </a> |
|---|
| 11 | <a href="https://docs.rs/plotters"> |
|---|
| 12 | <img style="display: inline!important" src="https://docs.rs/plotters/badge.svg"></img> |
|---|
| 13 | </a> |
|---|
| 14 | <a href="https://docs.rs/plotters"> |
|---|
| 15 | <img style="display: inline!important" src="https://img.shields.io/crates/d/plotters"></img> |
|---|
| 16 | </a> |
|---|
| 17 | <a href="https://plotters-rs.github.io/rustdoc/plotters/"> |
|---|
| 18 | <img style="display: inline! important" src="https://img.shields.io/badge/docs-development-lightgrey.svg"></img> |
|---|
| 19 | </a> |
|---|
| 20 | |
|---|
| 21 | Plotters is a drawing library designed for rendering figures, plots, and charts, in pure Rust. Plotters supports various types of back-ends, |
|---|
| 22 | including bitmap, vector graph, piston window, GTK/Cairo and WebAssembly. |
|---|
| 23 | |
|---|
| 24 | - A new Plotters Developer's Guide is a work in progress. The preview version is available [here](https://plotters-rs.github.io/book). |
|---|
| 25 | - Try Plotters with an interactive Jupyter notebook, or view [here](https://plotters-rs.github.io/plotters-doc-data/evcxr-jupyter-integration.html) for the static HTML version. |
|---|
| 26 | - To view the WASM example, go to this [link](https://plotters-rs.github.io/wasm-demo/www/index.html) |
|---|
| 27 | - Currently we have all the internal code ready for console plotting, but a console based backend is still not ready. See [this example](https://github.com/plotters-rs/plotters/blob/master/plotters/examples/console.rs) for how to plot on console with a customized backend. |
|---|
| 28 | - Plotters has moved all backend code to separate repositories, check [FAQ list](#faq-list) for details |
|---|
| 29 | - Some interesting [demo projects](#demo-projects) are available, feel free to try them out. |
|---|
| 30 | |
|---|
| 31 | ## Gallery |
|---|
| 32 | |
|---|
| 33 | <div class="galleryItem"> |
|---|
| 34 | <a href="https://plotters-rs.github.io/plotters-doc-data/sample.png"> |
|---|
| 35 | <img src="https://plotters-rs.github.io/plotters-doc-data/sample.png" class="galleryItem"></img> |
|---|
| 36 | </a> |
|---|
| 37 | <div class="galleryText"> |
|---|
| 38 | Multiple Plot |
|---|
| 39 | <a href="https://github.com/plotters-rs/plotters/blob/master/plotters/examples/chart.rs">[code]</a> |
|---|
| 40 | </div> |
|---|
| 41 | </div> |
|---|
| 42 | |
|---|
| 43 | <div class="galleryItem"> |
|---|
| 44 | <a href="https://plotters-rs.github.io/plotters-doc-data/stock.png"> |
|---|
| 45 | <img src="https://plotters-rs.github.io/plotters-doc-data/stock.png" class="galleryItem"></img> |
|---|
| 46 | </a> |
|---|
| 47 | <div class="galleryText"> |
|---|
| 48 | Candlestick Plot |
|---|
| 49 | <a href="https://github.com/plotters-rs/plotters/blob/master/plotters/examples/stock.rs">[code]</a> |
|---|
| 50 | </div> |
|---|
| 51 | </div> |
|---|
| 52 | |
|---|
| 53 | <div class="galleryItem"> |
|---|
| 54 | <a href="https://plotters-rs.github.io/plotters-doc-data/histogram.png"> |
|---|
| 55 | <img src="https://plotters-rs.github.io/plotters-doc-data/histogram.png" class="galleryItem"></img> |
|---|
| 56 | </a> |
|---|
| 57 | <div class="galleryText"> |
|---|
| 58 | Histogram |
|---|
| 59 | <a href="https://github.com/plotters-rs/plotters/blob/master/plotters/examples/histogram.rs">[code]</a> |
|---|
| 60 | </div> |
|---|
| 61 | </div> |
|---|
| 62 | |
|---|
| 63 | <div class="galleryItem"> |
|---|
| 64 | <a href="https://plotters-rs.github.io/plotters-doc-data/0.png"> |
|---|
| 65 | <img src="https://plotters-rs.github.io/plotters-doc-data/0.png" class="galleryItem"></img> |
|---|
| 66 | </a> |
|---|
| 67 | <div class="galleryText"> |
|---|
| 68 | Simple Chart |
|---|
| 69 | </div> |
|---|
| 70 | </div> |
|---|
| 71 | |
|---|
| 72 | <div class="galleryItem"> |
|---|
| 73 | <a href="https://plotters-rs.github.io/plotters-doc-data/console-2.png"> |
|---|
| 74 | <img src="https://plotters-rs.github.io/plotters-doc-data/console-2.png" class="galleryItem"></img> |
|---|
| 75 | </a> |
|---|
| 76 | <div class="galleryText"> |
|---|
| 77 | Plotting the Console |
|---|
| 78 | </div> |
|---|
| 79 | </div> |
|---|
| 80 | |
|---|
| 81 | <div class="galleryItem"> |
|---|
| 82 | <a href="https://plotters-rs.github.io/plotters-doc-data/mandelbrot.png"> |
|---|
| 83 | <img src="https://plotters-rs.github.io/plotters-doc-data/mandelbrot.png" class="galleryItem"></img> |
|---|
| 84 | </a> |
|---|
| 85 | <div class="galleryText"> |
|---|
| 86 | Mandelbrot set |
|---|
| 87 | <a href="https://github.com/plotters-rs/plotters/blob/master/plotters/examples/mandelbrot.rs">[code]</a> |
|---|
| 88 | </div> |
|---|
| 89 | </div> |
|---|
| 90 | |
|---|
| 91 | |
|---|
| 92 | <div class="galleryItem"> |
|---|
| 93 | <a href="https://plotters-rs.github.io/plotters-doc-data/evcxr_animation.gif"> |
|---|
| 94 | <img src="https://plotters-rs.github.io/plotters-doc-data/evcxr_animation.gif" class="galleryItem"></img> |
|---|
| 95 | </a> |
|---|
| 96 | <div class="galleryText"> |
|---|
| 97 | Jupyter Support |
|---|
| 98 | </div> |
|---|
| 99 | </div> |
|---|
| 100 | |
|---|
| 101 | <div class="galleryItem"> |
|---|
| 102 | <a href="https://plotters-rs.github.io/plotters-doc-data/plotters-piston.gif"> |
|---|
| 103 | <img src="https://plotters-rs.github.io/plotters-doc-data/plotters-piston.gif" class="galleryItem"></img> |
|---|
| 104 | </a> |
|---|
| 105 | <div class="galleryText"> |
|---|
| 106 | Real-time Rendering |
|---|
| 107 | <a href="https://github.com/plotters-rs/plotters-piston/blob/master/examples/cpustat.rs">[code]</a> |
|---|
| 108 | </div> |
|---|
| 109 | </div> |
|---|
| 110 | |
|---|
| 111 | <div class="galleryItem"> |
|---|
| 112 | <a href="https://plotters-rs.github.io/plotters-doc-data/normal-dist.png"> |
|---|
| 113 | <img src="https://plotters-rs.github.io/plotters-doc-data/normal-dist.png" class="galleryItem"></img> |
|---|
| 114 | </a> |
|---|
| 115 | <div class="galleryText"> |
|---|
| 116 | Histogram with Scatter |
|---|
| 117 | <a href="https://github.com/plotters-rs/plotters/blob/master/plotters/examples/normal-dist.rs">[code]</a> |
|---|
| 118 | </div> |
|---|
| 119 | </div> |
|---|
| 120 | |
|---|
| 121 | <div class="galleryItem"> |
|---|
| 122 | <a href="https://plotters-rs.github.io/plotters-doc-data/twoscale.png"> |
|---|
| 123 | <img src="https://plotters-rs.github.io/plotters-doc-data/twoscale.png" class="galleryItem"></img> |
|---|
| 124 | </a> |
|---|
| 125 | <div class="galleryText"> |
|---|
| 126 | Dual Y-Axis Example |
|---|
| 127 | <a href="https://github.com/plotters-rs/plotters/blob/master/plotters/examples/two-scales.rs">[code]</a> |
|---|
| 128 | </div> |
|---|
| 129 | </div> |
|---|
| 130 | |
|---|
| 131 | <div class="galleryItem"> |
|---|
| 132 | <a href="https://plotters-rs.github.io/plotters-doc-data/matshow.png"> |
|---|
| 133 | <img src="https://plotters-rs.github.io/plotters-doc-data/matshow.png" class="galleryItem"></img> |
|---|
| 134 | </a> |
|---|
| 135 | <div class="galleryText"> |
|---|
| 136 | The Matplotlib Matshow Example |
|---|
| 137 | <a href="https://github.com/plotters-rs/plotters/blob/master/plotters/examples/matshow.rs">[code]</a> |
|---|
| 138 | </div> |
|---|
| 139 | </div> |
|---|
| 140 | |
|---|
| 141 | <div class="galleryItem"> |
|---|
| 142 | <a href="https://plotters-rs.github.io/plotters-doc-data/sierpinski.png"> |
|---|
| 143 | <img src="https://plotters-rs.github.io/plotters-doc-data/sierpinski.png" class="galleryItem"></img> |
|---|
| 144 | </a> |
|---|
| 145 | <div class="galleryText"> |
|---|
| 146 | The Sierpinski Carpet |
|---|
| 147 | <a href="https://github.com/plotters-rs/plotters/blob/master/plotters/examples/sierpinski.rs">[code]</a> |
|---|
| 148 | </div> |
|---|
| 149 | </div> |
|---|
| 150 | |
|---|
| 151 | <div class="galleryItem"> |
|---|
| 152 | <a href="https://plotters-rs.github.io/plotters-doc-data/normal-dist2.png"> |
|---|
| 153 | <img src="https://plotters-rs.github.io/plotters-doc-data/normal-dist2.png" class="galleryItem"></img> |
|---|
| 154 | </a> |
|---|
| 155 | <div class="galleryText"> |
|---|
| 156 | The 1D Gaussian Distribution |
|---|
| 157 | <a href="https://github.com/plotters-rs/plotters/blob/master/plotters/examples/normal-dist2.rs">[code]</a> |
|---|
| 158 | </div> |
|---|
| 159 | </div> |
|---|
| 160 | |
|---|
| 161 | <div class="galleryItem"> |
|---|
| 162 | <a href="https://plotters-rs.github.io/plotters-doc-data/errorbar.png"> |
|---|
| 163 | <img src="https://plotters-rs.github.io/plotters-doc-data/errorbar.png" class="galleryItem"></img> |
|---|
| 164 | </a> |
|---|
| 165 | <div class="galleryText"> |
|---|
| 166 | The 1D Gaussian Distribution |
|---|
| 167 | <a href="https://github.com/plotters-rs/plotters/blob/master/plotters/examples/errorbar.rs">[code]</a> |
|---|
| 168 | </div> |
|---|
| 169 | </div> |
|---|
| 170 | |
|---|
| 171 | <div class="galleryItem"> |
|---|
| 172 | <a href="https://plotters-rs.github.io/plotters-doc-data/slc-temp.png"> |
|---|
| 173 | <img src="https://plotters-rs.github.io/plotters-doc-data/slc-temp.png" class="galleryItem"></img> |
|---|
| 174 | </a> |
|---|
| 175 | <div class="galleryText"> |
|---|
| 176 | Monthly Time Coordinate |
|---|
| 177 | <a href="https://github.com/plotters-rs/plotters/blob/master/plotters/examples/slc-temp.rs">[code]</a> |
|---|
| 178 | </div> |
|---|
| 179 | </div> |
|---|
| 180 | |
|---|
| 181 | <div class="galleryItem"> |
|---|
| 182 | <a href="https://plotters-rs.github.io/plotters-doc-data/area-chart.png"> |
|---|
| 183 | <img src="https://plotters-rs.github.io/plotters-doc-data/area-chart.png" class="galleryItem"></img> |
|---|
| 184 | </a> |
|---|
| 185 | <div class="galleryText"> |
|---|
| 186 | Monthly Time Coordinate |
|---|
| 187 | <a href="https://github.com/plotters-rs/plotters/blob/master/plotters/examples/area-chart.rs">[code]</a> |
|---|
| 188 | </div> |
|---|
| 189 | </div> |
|---|
| 190 | |
|---|
| 191 | <div class="galleryItem"> |
|---|
| 192 | <a href="https://plotters-rs.github.io/plotters-doc-data/snowflake.png"> |
|---|
| 193 | <img src="https://plotters-rs.github.io/plotters-doc-data/snowflake.png" class="galleryItem"></img> |
|---|
| 194 | </a> |
|---|
| 195 | <div class="galleryText"> |
|---|
| 196 | Koch Snowflake |
|---|
| 197 | <a href="https://github.com/plotters-rs/plotters/blob/master/plotters/examples/snowflake.rs">[code]</a> |
|---|
| 198 | </div> |
|---|
| 199 | </div> |
|---|
| 200 | |
|---|
| 201 | |
|---|
| 202 | <div class="galleryItem"> |
|---|
| 203 | <a href="https://plotters-rs.github.io/plotters-doc-data/animation.gif"> |
|---|
| 204 | <img src="https://plotters-rs.github.io/plotters-doc-data/animation.gif" class="galleryItem"></img> |
|---|
| 205 | </a> |
|---|
| 206 | <div class="galleryText"> |
|---|
| 207 | Koch Snowflake Animation |
|---|
| 208 | <a href="https://github.com/plotters-rs/plotters/blob/master/plotters/examples/animation.rs">[code]</a> |
|---|
| 209 | </div> |
|---|
| 210 | </div> |
|---|
| 211 | |
|---|
| 212 | |
|---|
| 213 | <div class="galleryItem"> |
|---|
| 214 | <a href="https://plotters-rs.github.io/plotters-doc-data/console.png"> |
|---|
| 215 | <img src="https://plotters-rs.github.io/plotters-doc-data/console.png" class="galleryItem"></img> |
|---|
| 216 | </a> |
|---|
| 217 | <div class="galleryText"> |
|---|
| 218 | Drawing on a Console |
|---|
| 219 | <a href="https://github.com/plotters-rs/plotters/blob/master/plotters/examples/console.rs">[code]</a> |
|---|
| 220 | </div> |
|---|
| 221 | </div> |
|---|
| 222 | |
|---|
| 223 | <div class="galleryItem"> |
|---|
| 224 | <a href="https://plotters-rs.github.io/plotters-doc-data/blit-bitmap.png"> |
|---|
| 225 | <img src="https://plotters-rs.github.io/plotters-doc-data/blit-bitmap.png" class="galleryItem"></img> |
|---|
| 226 | </a> |
|---|
| 227 | <div class="galleryText"> |
|---|
| 228 | Drawing bitmap on chart |
|---|
| 229 | <a href="https://github.com/plotters-rs/plotters/blob/master/plotters/examples/blit-bitmap.rs">[code]</a> |
|---|
| 230 | </div> |
|---|
| 231 | </div> |
|---|
| 232 | |
|---|
| 233 | <div class="galleryItem"> |
|---|
| 234 | <a href="https://plotters-rs.github.io/plotters-doc-data/boxplot.svg"> |
|---|
| 235 | <img src="https://plotters-rs.github.io/plotters-doc-data/boxplot.svg" class="galleryItem"></img> |
|---|
| 236 | </a> |
|---|
| 237 | <div class="galleryText"> |
|---|
| 238 | The boxplot demo |
|---|
| 239 | <a href="https://github.com/plotters-rs/plotters/blob/master/plotters/examples/boxplot.rs">[code]</a> |
|---|
| 240 | </div> |
|---|
| 241 | </div> |
|---|
| 242 | |
|---|
| 243 | <div class="galleryItem"> |
|---|
| 244 | <a href="https://plotters-rs.github.io/plotters-doc-data/3d-plot.svg"> |
|---|
| 245 | <img src="https://plotters-rs.github.io/plotters-doc-data/3d-plot.svg" class="galleryItem"></img> |
|---|
| 246 | </a> |
|---|
| 247 | <div class="galleryText"> |
|---|
| 248 | 3D plot rendering |
|---|
| 249 | <a href="https://github.com/plotters-rs/plotters/blob/master/plotters/examples/3d-plot.rs">[code]</a> |
|---|
| 250 | </div> |
|---|
| 251 | </div> |
|---|
| 252 | |
|---|
| 253 | <div class="galleryItem"> |
|---|
| 254 | <a href="https://plotters-rs.github.io/plotters-doc-data/3d-plot2.gif"> |
|---|
| 255 | <img src="https://plotters-rs.github.io/plotters-doc-data/3d-plot2.gif" class="galleryItem"></img> |
|---|
| 256 | </a> |
|---|
| 257 | <div class="galleryText"> |
|---|
| 258 | 2-Var Gussian Distribution PDF |
|---|
| 259 | <a href="https://github.com/plotters-rs/plotters/blob/master/plotters/examples/3d-plot2.rs">[code]</a> |
|---|
| 260 | </div> |
|---|
| 261 | </div> |
|---|
| 262 | |
|---|
| 263 | <div class="galleryItem"> |
|---|
| 264 | <a href="https://plotters-rs.github.io/plotters-doc-data/tick_control.svg"> |
|---|
| 265 | <img src="https://plotters-rs.github.io/plotters-doc-data/tick_control.svg" class="galleryItem"></img> |
|---|
| 266 | </a> |
|---|
| 267 | <div class="galleryText"> |
|---|
| 268 | COVID-19 Visualization |
|---|
| 269 | <a href="https://github.com/plotters-rs/plotters/blob/master/plotters/examples/tick_control.rs">[code]</a> |
|---|
| 270 | </div> |
|---|
| 271 | </div> |
|---|
| 272 | |
|---|
| 273 | |
|---|
| 274 | ## Table of Contents |
|---|
| 275 | * [Gallery](#gallery) |
|---|
| 276 | * [Dependencies](#dependencies) |
|---|
| 277 | + [Ubuntu Linux](#ubuntu-linux) |
|---|
| 278 | * [Quick Start](#quick-start) |
|---|
| 279 | * [Demo Projects](#demo-projects) |
|---|
| 280 | * [Trying with Jupyter evcxr Kernel Interactively](#trying-with-jupyter-evcxr-kernel-interactively) |
|---|
| 281 | * [Interactive Tutorial with Jupyter Notebook](#interactive-tutorial-with-jupyter-notebook) |
|---|
| 282 | * [Plotting in Rust](#plotting-in-rust) |
|---|
| 283 | * [Plotting on HTML5 canvas with WASM Backend](#plotting-on-html5-canvas-with-wasm-backend) |
|---|
| 284 | * [What types of figure are supported?](#what-types-of-figure-are-supported) |
|---|
| 285 | * [Concepts by example](#concepts-by-example) |
|---|
| 286 | + [Drawing Backends](#drawing-backends) |
|---|
| 287 | + [Drawing Area](#drawing-area) |
|---|
| 288 | + [Elements](#elements) |
|---|
| 289 | + [Composable Elements](#composable-elements) |
|---|
| 290 | + [Chart Context](#chart-context) |
|---|
| 291 | * [Misc](#misc) |
|---|
| 292 | + [Development Version](#development-version) |
|---|
| 293 | + [Reducing Depending Libraries && Turning Off Backends](#reducing-depending-libraries--turning-off-backends) |
|---|
| 294 | + [List of Features](#list-of-features) |
|---|
| 295 | * [FAQ List](#faq-list) |
|---|
| 296 | |
|---|
| 297 | ## Dependencies |
|---|
| 298 | |
|---|
| 299 | ### Ubuntu Linux |
|---|
| 300 | |
|---|
| 301 | ```sudo apt install pkg-config libfreetype6-dev libfontconfig1-dev``` |
|---|
| 302 | |
|---|
| 303 | ## Quick Start |
|---|
| 304 | |
|---|
| 305 | To use Plotters, you can simply add Plotters into your `Cargo.toml` |
|---|
| 306 | ```toml |
|---|
| 307 | [dependencies] |
|---|
| 308 | plotters = "0.3.3" |
|---|
| 309 | ``` |
|---|
| 310 | |
|---|
| 311 | And the following code draws a quadratic function. `src/main.rs`, |
|---|
| 312 | |
|---|
| 313 | ```rust |
|---|
| 314 | use plotters::prelude::*; |
|---|
| 315 | fn main() -> Result<(), Box<dyn std::error::Error>> { |
|---|
| 316 | let root = BitMapBackend::new("plotters-doc-data/0.png", (640, 480)).into_drawing_area(); |
|---|
| 317 | root.fill(&WHITE)?; |
|---|
| 318 | let mut chart = ChartBuilder::on(&root) |
|---|
| 319 | .caption("y=x^2", ("sans-serif", 50).into_font()) |
|---|
| 320 | .margin(5) |
|---|
| 321 | .x_label_area_size(30) |
|---|
| 322 | .y_label_area_size(30) |
|---|
| 323 | .build_cartesian_2d(-1f32..1f32, -0.1f32..1f32)?; |
|---|
| 324 | |
|---|
| 325 | chart.configure_mesh().draw()?; |
|---|
| 326 | |
|---|
| 327 | chart |
|---|
| 328 | .draw_series(LineSeries::new( |
|---|
| 329 | (-50..=50).map(|x| x as f32 / 50.0).map(|x| (x, x * x)), |
|---|
| 330 | &RED, |
|---|
| 331 | ))? |
|---|
| 332 | .label("y = x^2") |
|---|
| 333 | .legend(|(x, y)| PathElement::new(vec![(x, y), (x + 20, y)], &RED)); |
|---|
| 334 | |
|---|
| 335 | chart |
|---|
| 336 | .configure_series_labels() |
|---|
| 337 | .background_style(&WHITE.mix(0.8)) |
|---|
| 338 | .border_style(&BLACK) |
|---|
| 339 | .draw()?; |
|---|
| 340 | |
|---|
| 341 | root.present()?; |
|---|
| 342 | |
|---|
| 343 | Ok(()) |
|---|
| 344 | } |
|---|
| 345 | ``` |
|---|
| 346 | |
|---|
| 347 | 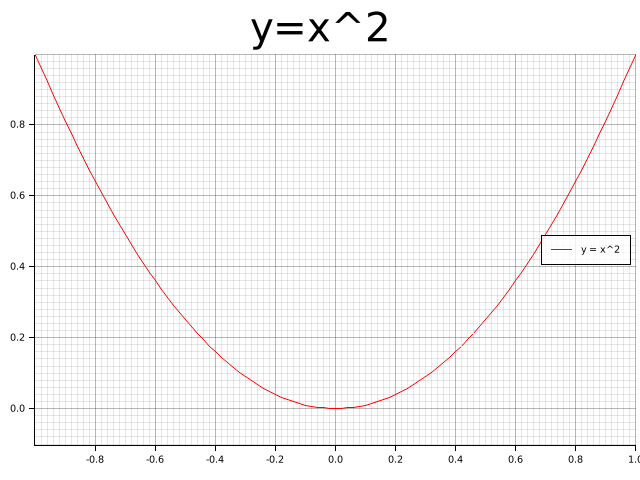 |
|---|
| 348 | |
|---|
| 349 | ## Demo Projects |
|---|
| 350 | |
|---|
| 351 | To learn how to use Plotters in different scenarios, check out the following demo projects: |
|---|
| 352 | |
|---|
| 353 | - WebAssembly + Plotters: [plotters-wasm-demo](https://github.com/plotters-rs/plotters-wasm-demo) |
|---|
| 354 | - minifb + Plotters: [plotters-minifb-demo](https://github.com/plotters-rs/plotters-minifb-demo) |
|---|
| 355 | - GTK + Plotters: [plotters-gtk-demo](https://github.com/plotters-rs/plotters-gtk-demo) |
|---|
| 356 | |
|---|
| 357 | |
|---|
| 358 | ## Trying with Jupyter evcxr Kernel Interactively |
|---|
| 359 | |
|---|
| 360 | Plotters now supports integration with `evcxr` and is able to interactively draw plots in Jupyter Notebook. |
|---|
| 361 | The feature `evcxr` should be enabled when including Plotters to Jupyter Notebook. |
|---|
| 362 | |
|---|
| 363 | The following code shows a minimal example of this. |
|---|
| 364 | |
|---|
| 365 | ```text |
|---|
| 366 | :dep plotters = { version = "^0.3.6", default-features = false, features = ["evcxr", "all_series", "all_elements"] } |
|---|
| 367 | extern crate plotters; |
|---|
| 368 | use plotters::prelude::*; |
|---|
| 369 | |
|---|
| 370 | let figure = evcxr_figure((640, 480), |root| { |
|---|
| 371 | root.fill(&WHITE)?; |
|---|
| 372 | let mut chart = ChartBuilder::on(&root) |
|---|
| 373 | .caption("y=x^2", ("Arial", 50).into_font()) |
|---|
| 374 | .margin(5) |
|---|
| 375 | .x_label_area_size(30) |
|---|
| 376 | .y_label_area_size(30) |
|---|
| 377 | .build_cartesian_2d(-1f32..1f32, -0.1f32..1f32)?; |
|---|
| 378 | |
|---|
| 379 | chart.configure_mesh().draw()?; |
|---|
| 380 | |
|---|
| 381 | chart.draw_series(LineSeries::new( |
|---|
| 382 | (-50..=50).map(|x| x as f32 / 50.0).map(|x| (x, x * x)), |
|---|
| 383 | &RED, |
|---|
| 384 | )).unwrap() |
|---|
| 385 | .label("y = x^2") |
|---|
| 386 | .legend(|(x,y)| PathElement::new(vec![(x,y), (x + 20,y)], &RED)); |
|---|
| 387 | |
|---|
| 388 | chart.configure_series_labels() |
|---|
| 389 | .background_style(&WHITE.mix(0.8)) |
|---|
| 390 | .border_style(&BLACK) |
|---|
| 391 | .draw()?; |
|---|
| 392 | Ok(()) |
|---|
| 393 | }); |
|---|
| 394 | figure |
|---|
| 395 | ``` |
|---|
| 396 | |
|---|
| 397 | <img src="https://plotters-rs.github.io/plotters-doc-data/evcxr_animation.gif" width="450px" ></img> |
|---|
| 398 | |
|---|
| 399 | ## Interactive Tutorial with Jupyter Notebook |
|---|
| 400 | |
|---|
| 401 | *This tutorial is a work in progress and isn't complete* |
|---|
| 402 | |
|---|
| 403 | Thanks to the evcxr, now we have an interactive tutorial for Plotters! |
|---|
| 404 | To use the interactive notebook, you must have Jupyter and evcxr installed on your computer. |
|---|
| 405 | Follow the instruction on [this page](https://github.com/google/evcxr/tree/master/evcxr_jupyter) below to install it. |
|---|
| 406 | |
|---|
| 407 | After that, you should be able to start your Jupyter server locally and load the tutorial! |
|---|
| 408 | |
|---|
| 409 | ```bash |
|---|
| 410 | git clone https://github.com/38/plotters-doc-data |
|---|
| 411 | cd plotters-doc-data |
|---|
| 412 | jupyter notebook |
|---|
| 413 | ``` |
|---|
| 414 | |
|---|
| 415 | And select the notebook called `evcxr-jupyter-integration.ipynb`. |
|---|
| 416 | |
|---|
| 417 | Also, there's a static HTML version of this notebook available at [this location](https://plotters-rs.github.io/plotters-doc-data/evcxr-jupyter-integration.html) |
|---|
| 418 | |
|---|
| 419 | ## Plotting in Rust |
|---|
| 420 | |
|---|
| 421 | Rust is a perfect language for data visualization. Although there are many mature visualization libraries in many different languages, Rust is one of the best languages that fits the need. |
|---|
| 422 | |
|---|
| 423 | * **Easy to use** Rust has a very good iterator system built into the standard library. With the help of iterators, |
|---|
| 424 | plotting in Rust can be as easy as most of the high-level programming languages. The Rust based plotting library |
|---|
| 425 | can be very easy to use. |
|---|
| 426 | |
|---|
| 427 | * **Fast** If you need to render a figure with trillions of data points, |
|---|
| 428 | Rust is a good choice. Rust's performance allows you to combine the data processing step |
|---|
| 429 | and rendering step into a single application. When plotting in high-level programming languages, |
|---|
| 430 | e.g. Javascript or Python, data points must be down-sampled before feeding into the plotting |
|---|
| 431 | program because of the performance considerations. Rust is fast enough to do the data processing and visualization |
|---|
| 432 | within a single program. You can also integrate the |
|---|
| 433 | figure rendering code into your application to handle a huge amount of data and visualize it in real-time. |
|---|
| 434 | |
|---|
| 435 | * **WebAssembly Support** Rust is one of the languages with the best WASM support. Plotting in Rust could be |
|---|
| 436 | very useful for visualization on a web page and would have a huge performance improvement comparing to Javascript. |
|---|
| 437 | |
|---|
| 438 | ## Plotting on HTML5 canvas with WASM Backend |
|---|
| 439 | |
|---|
| 440 | Plotters currently supports a backend that uses the HTML5 canvas. To use WASM, you can simply use |
|---|
| 441 | `CanvasBackend` instead of other backend and all other API remains the same! |
|---|
| 442 | |
|---|
| 443 | There's a small demo for Plotters + WASM available at [here](https://github.com/plotters-rs/plotters-wasm-demo). |
|---|
| 444 | To play with the deployed version, follow this [link](https://plotters-rs.github.io/wasm-demo/www/index.html). |
|---|
| 445 | |
|---|
| 446 | ## What types of figure are supported? |
|---|
| 447 | |
|---|
| 448 | Plotters is not limited to any specific type of figure. |
|---|
| 449 | You can create your own types of figures easily with the Plotters API. |
|---|
| 450 | |
|---|
| 451 | Plotters does provide some built-in figure types for convenience. |
|---|
| 452 | Currently, we support line series, point series, candlestick series, and histogram. |
|---|
| 453 | And the library is designed to be able to render multiple figure into a single image. |
|---|
| 454 | But Plotter is aimed to be a platform that is fully extendable to support any other types of figure. |
|---|
| 455 | |
|---|
| 456 | ## Concepts by example |
|---|
| 457 | |
|---|
| 458 | ### Drawing Backends |
|---|
| 459 | Plotters can use different drawing backends, including SVG, BitMap, and even real-time rendering. For example, a bitmap drawing backend. |
|---|
| 460 | |
|---|
| 461 | ```rust |
|---|
| 462 | use plotters::prelude::*; |
|---|
| 463 | fn main() -> Result<(), Box<dyn std::error::Error>> { |
|---|
| 464 | // Create a 800*600 bitmap and start drawing |
|---|
| 465 | let mut backend = BitMapBackend::new("plotters-doc-data/1.png", (300, 200)); |
|---|
| 466 | // And if we want SVG backend |
|---|
| 467 | // let backend = SVGBackend::new("output.svg", (800, 600)); |
|---|
| 468 | backend.draw_rect((50, 50), (200, 150), &RED, true)?; |
|---|
| 469 | backend.present()?; |
|---|
| 470 | Ok(()) |
|---|
| 471 | } |
|---|
| 472 | ``` |
|---|
| 473 | |
|---|
| 474 |  |
|---|
| 475 | |
|---|
| 476 | ### Drawing Area |
|---|
| 477 | Plotters uses a concept called drawing area for layout purpose. |
|---|
| 478 | Plotters supports integrating multiple figures into a single image. |
|---|
| 479 | This is done by creating sub-drawing-areas. |
|---|
| 480 | |
|---|
| 481 | Besides that, the drawing area also allows for a customized coordinate system, by doing so, the coordinate mapping is done by the drawing area automatically. |
|---|
| 482 | |
|---|
| 483 | ```rust |
|---|
| 484 | use plotters::prelude::*; |
|---|
| 485 | fn main() -> Result<(), Box<dyn std::error::Error>> { |
|---|
| 486 | let root_drawing_area = |
|---|
| 487 | BitMapBackend::new("plotters-doc-data/2.png", (300, 200)).into_drawing_area(); |
|---|
| 488 | // And we can split the drawing area into 3x3 grid |
|---|
| 489 | let child_drawing_areas = root_drawing_area.split_evenly((3, 3)); |
|---|
| 490 | // Then we fill the drawing area with different color |
|---|
| 491 | for (area, color) in child_drawing_areas.into_iter().zip(0..) { |
|---|
| 492 | area.fill(&Palette99::pick(color))?; |
|---|
| 493 | } |
|---|
| 494 | root_drawing_area.present()?; |
|---|
| 495 | Ok(()) |
|---|
| 496 | } |
|---|
| 497 | ``` |
|---|
| 498 | |
|---|
| 499 |  |
|---|
| 500 | |
|---|
| 501 | ### Elements |
|---|
| 502 | |
|---|
| 503 | In Plotters, elements are the building blocks of figures. All elements are able to be drawn on a drawing area. |
|---|
| 504 | There are different types of built-in elements, like lines, texts, circles, etc. |
|---|
| 505 | You can also define your own element in the application code. |
|---|
| 506 | |
|---|
| 507 | You may also combine existing elements to build a complex element. |
|---|
| 508 | |
|---|
| 509 | To learn more about the element system, please read the [element module documentation](./element/index.html). |
|---|
| 510 | |
|---|
| 511 | ```rust |
|---|
| 512 | use plotters::prelude::*; |
|---|
| 513 | fn main() -> Result<(), Box<dyn std::error::Error>> { |
|---|
| 514 | let root = BitMapBackend::new("plotters-doc-data/3.png", (300, 200)).into_drawing_area(); |
|---|
| 515 | root.fill(&WHITE)?; |
|---|
| 516 | // Draw an circle on the drawing area |
|---|
| 517 | root.draw(&Circle::new( |
|---|
| 518 | (100, 100), |
|---|
| 519 | 50, |
|---|
| 520 | Into::<ShapeStyle>::into(&GREEN).filled(), |
|---|
| 521 | ))?; |
|---|
| 522 | root.present()?; |
|---|
| 523 | Ok(()) |
|---|
| 524 | } |
|---|
| 525 | ``` |
|---|
| 526 | |
|---|
| 527 |  |
|---|
| 528 | |
|---|
| 529 | ### Composable Elements |
|---|
| 530 | |
|---|
| 531 | Besides the built-in elements, elements can be composed into a logical group we called composed elements. |
|---|
| 532 | When composing new elements, the upper-left corner is given in the target coordinate, and a new pixel-based |
|---|
| 533 | coordinate which has the upper-left corner defined as `(0,0)` is used for further element composition. |
|---|
| 534 | |
|---|
| 535 | For example, we can have an element which includes a dot and its coordinate. |
|---|
| 536 | |
|---|
| 537 | ```rust |
|---|
| 538 | use plotters::prelude::*; |
|---|
| 539 | use plotters::coord::types::RangedCoordf32; |
|---|
| 540 | |
|---|
| 541 | fn main() -> Result<(), Box<dyn std::error::Error>> { |
|---|
| 542 | let root = BitMapBackend::new("plotters-doc-data/4.png", (640, 480)).into_drawing_area(); |
|---|
| 543 | |
|---|
| 544 | root.fill(&RGBColor(240, 200, 200))?; |
|---|
| 545 | |
|---|
| 546 | let root = root.apply_coord_spec(Cartesian2d::<RangedCoordf32, RangedCoordf32>::new( |
|---|
| 547 | 0f32..1f32, |
|---|
| 548 | 0f32..1f32, |
|---|
| 549 | (0..640, 0..480), |
|---|
| 550 | )); |
|---|
| 551 | |
|---|
| 552 | let dot_and_label = |x: f32, y: f32| { |
|---|
| 553 | return EmptyElement::at((x, y)) |
|---|
| 554 | + Circle::new((0, 0), 3, ShapeStyle::from(&BLACK).filled()) |
|---|
| 555 | + Text::new( |
|---|
| 556 | format!("({:.2},{:.2})", x, y), |
|---|
| 557 | (10, 0), |
|---|
| 558 | ("sans-serif", 15.0).into_font(), |
|---|
| 559 | ); |
|---|
| 560 | }; |
|---|
| 561 | |
|---|
| 562 | root.draw(&dot_and_label(0.5, 0.6))?; |
|---|
| 563 | root.draw(&dot_and_label(0.25, 0.33))?; |
|---|
| 564 | root.draw(&dot_and_label(0.8, 0.8))?; |
|---|
| 565 | root.present()?; |
|---|
| 566 | Ok(()) |
|---|
| 567 | } |
|---|
| 568 | ``` |
|---|
| 569 | |
|---|
| 570 | 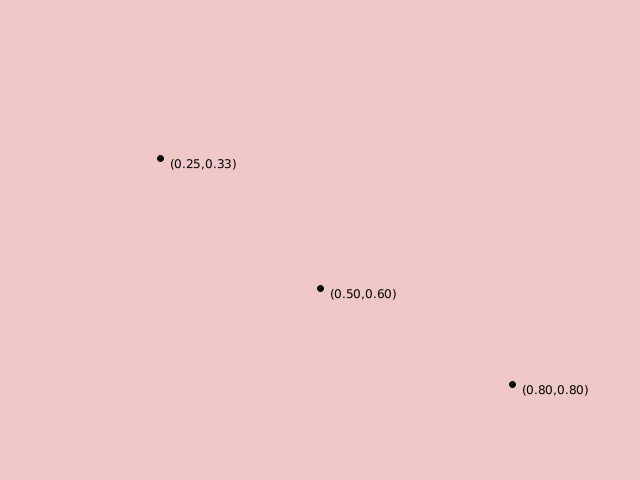 |
|---|
| 571 | |
|---|
| 572 | ### Chart Context |
|---|
| 573 | |
|---|
| 574 | In order to draw a chart, Plotters needs a data object built on top of the drawing area called `ChartContext`. |
|---|
| 575 | The chart context defines even higher level constructs compare to the drawing area. |
|---|
| 576 | For example, you can define the label areas, meshes, and put a data series onto the drawing area with the help |
|---|
| 577 | of the chart context object. |
|---|
| 578 | |
|---|
| 579 | ```rust |
|---|
| 580 | use plotters::prelude::*; |
|---|
| 581 | fn main() -> Result<(), Box<dyn std::error::Error>> { |
|---|
| 582 | let root = BitMapBackend::new("plotters-doc-data/5.png", (640, 480)).into_drawing_area(); |
|---|
| 583 | root.fill(&WHITE); |
|---|
| 584 | let root = root.margin(10, 10, 10, 10); |
|---|
| 585 | // After this point, we should be able to construct a chart context |
|---|
| 586 | let mut chart = ChartBuilder::on(&root) |
|---|
| 587 | // Set the caption of the chart |
|---|
| 588 | .caption("This is our first plot", ("sans-serif", 40).into_font()) |
|---|
| 589 | // Set the size of the label region |
|---|
| 590 | .x_label_area_size(20) |
|---|
| 591 | .y_label_area_size(40) |
|---|
| 592 | // Finally attach a coordinate on the drawing area and make a chart context |
|---|
| 593 | .build_cartesian_2d(0f32..10f32, 0f32..10f32)?; |
|---|
| 594 | |
|---|
| 595 | // Then we can draw a mesh |
|---|
| 596 | chart |
|---|
| 597 | .configure_mesh() |
|---|
| 598 | // We can customize the maximum number of labels allowed for each axis |
|---|
| 599 | .x_labels(5) |
|---|
| 600 | .y_labels(5) |
|---|
| 601 | // We can also change the format of the label text |
|---|
| 602 | .y_label_formatter(&|x| format!("{:.3}", x)) |
|---|
| 603 | .draw()?; |
|---|
| 604 | |
|---|
| 605 | // And we can draw something in the drawing area |
|---|
| 606 | chart.draw_series(LineSeries::new( |
|---|
| 607 | vec![(0.0, 0.0), (5.0, 5.0), (8.0, 7.0)], |
|---|
| 608 | &RED, |
|---|
| 609 | ))?; |
|---|
| 610 | // Similarly, we can draw point series |
|---|
| 611 | chart.draw_series(PointSeries::of_element( |
|---|
| 612 | vec![(0.0, 0.0), (5.0, 5.0), (8.0, 7.0)], |
|---|
| 613 | 5, |
|---|
| 614 | &RED, |
|---|
| 615 | &|c, s, st| { |
|---|
| 616 | return EmptyElement::at(c) // We want to construct a composed element on-the-fly |
|---|
| 617 | + Circle::new((0,0),s,st.filled()) // At this point, the new pixel coordinate is established |
|---|
| 618 | + Text::new(format!("{:?}", c), (10, 0), ("sans-serif", 10).into_font()); |
|---|
| 619 | }, |
|---|
| 620 | ))?; |
|---|
| 621 | root.present()?; |
|---|
| 622 | Ok(()) |
|---|
| 623 | } |
|---|
| 624 | ``` |
|---|
| 625 | |
|---|
| 626 | 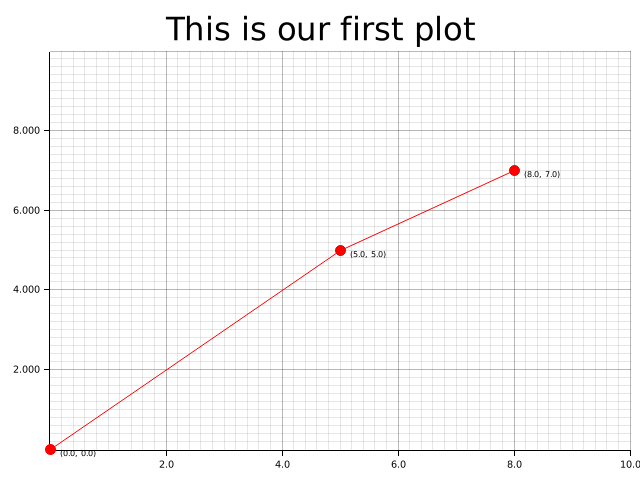 |
|---|
| 627 | |
|---|
| 628 | ## Misc |
|---|
| 629 | |
|---|
| 630 | ### Development Version |
|---|
| 631 | |
|---|
| 632 | Find the latest development version of Plotters on [GitHub](https://github.com/plotters-rs/plotters.git). |
|---|
| 633 | Clone the repository and learn more about the Plotters API and ways to contribute. Your help is needed! |
|---|
| 634 | |
|---|
| 635 | If you want to add the development version of Plotters to your project, add the following to your `Cargo.toml`: |
|---|
| 636 | |
|---|
| 637 | ```toml |
|---|
| 638 | [dependencies] |
|---|
| 639 | plotters = { git = "https://github.com/plotters-rs/plotters.git" } |
|---|
| 640 | ``` |
|---|
| 641 | |
|---|
| 642 | ### Reducing Depending Libraries && Turning Off Backends |
|---|
| 643 | Plotters now supports use features to control the backend dependencies. By default, `BitMapBackend` and `SVGBackend` are supported, |
|---|
| 644 | use `default-features = false` in the dependency description in `Cargo.toml` and you can cherry-pick the backend implementations. |
|---|
| 645 | |
|---|
| 646 | - `svg` Enable the `SVGBackend` |
|---|
| 647 | - `bitmap` Enable the `BitMapBackend` |
|---|
| 648 | |
|---|
| 649 | For example, the following dependency description would avoid compiling with bitmap support: |
|---|
| 650 | |
|---|
| 651 | ```toml |
|---|
| 652 | [dependencies] |
|---|
| 653 | plotters = { git = "https://github.com/plotters-rs/plotters.git", default-features = false, features = ["svg"] } |
|---|
| 654 | ``` |
|---|
| 655 | |
|---|
| 656 | The library also allows consumers to make use of the [`Palette`](https://crates.io/crates/palette/) crate's color types by default. |
|---|
| 657 | This behavior can also be turned off by setting `default-features = false`. |
|---|
| 658 | |
|---|
| 659 | ### List of Features |
|---|
| 660 | |
|---|
| 661 | This is the full list of features that is defined by `Plotters` crate. |
|---|
| 662 | Use `default-features = false` to disable those default enabled features, |
|---|
| 663 | and then you should be able to cherry-pick what features you want to include into `Plotters` crate. |
|---|
| 664 | By doing so, you can minimize the number of dependencies down to only `itertools` and compile time is less than 6s. |
|---|
| 665 | |
|---|
| 666 | The following list is a complete list of features that can be opted in or out. |
|---|
| 667 | |
|---|
| 668 | - Tier 1 drawing backends |
|---|
| 669 | |
|---|
| 670 | | Name | Description | Additional Dependency |Default?| |
|---|
| 671 | |---------|--------------|--------|------------| |
|---|
| 672 | | bitmap\_encoder | Allow `BitMapBackend` to save the result to bitmap files | image, rusttype, font-kit | Yes | |
|---|
| 673 | | svg\_backend | Enable `SVGBackend` Support | None | Yes | |
|---|
| 674 | | bitmap\_gif| Opt-in GIF animation Rendering support for `BitMapBackend`, implies `bitmap` enabled | gif | Yes | |
|---|
| 675 | |
|---|
| 676 | - Font manipulation features |
|---|
| 677 | |
|---|
| 678 | | Name | Description | Additional Dependency | Default? | |
|---|
| 679 | |----------|------------------------------------------|-----------------------|----------| |
|---|
| 680 | | ttf | Allows TrueType font support | font-kit | Yes | |
|---|
| 681 | | ab_glyph | Skips loading system fonts, unlike `ttf` | ab_glyph | No | |
|---|
| 682 | |
|---|
| 683 | `ab_glyph` supports TrueType and OpenType fonts, but does not attempt to |
|---|
| 684 | load fonts provided by the system on which it is running. |
|---|
| 685 | It is pure Rust, and easier to cross compile. |
|---|
| 686 | To use this, you *must* call `plotters::style::register_font` before |
|---|
| 687 | using any `plotters` functions which require the ability to render text. |
|---|
| 688 | This function only exists when the `ab_glyph` feature is enabled. |
|---|
| 689 | ```rust,ignore |
|---|
| 690 | /// Register a font in the fonts table. |
|---|
| 691 | /// |
|---|
| 692 | /// The `name` parameter gives the name this font shall be referred to |
|---|
| 693 | /// in the other APIs, like `"sans-serif"`. |
|---|
| 694 | /// |
|---|
| 695 | /// Unprovided font styles for a given name will fallback to `FontStyle::Normal` |
|---|
| 696 | /// if that is available for that name, when other functions lookup fonts which |
|---|
| 697 | /// are registered with this function. |
|---|
| 698 | /// |
|---|
| 699 | /// The `bytes` parameter should be the complete contents |
|---|
| 700 | /// of an OpenType font file, like: |
|---|
| 701 | /// ```ignore |
|---|
| 702 | /// include_bytes!("FiraGO-Regular.otf") |
|---|
| 703 | /// ``` |
|---|
| 704 | pub fn register_font( |
|---|
| 705 | name: &str, |
|---|
| 706 | style: FontStyle, |
|---|
| 707 | bytes: &'static [u8], |
|---|
| 708 | ) -> Result<(), InvalidFont> |
|---|
| 709 | ``` |
|---|
| 710 | |
|---|
| 711 | - Coordinate features |
|---|
| 712 | |
|---|
| 713 | | Name | Description | Additional Dependency |Default?| |
|---|
| 714 | |---------|--------------|--------|------------| |
|---|
| 715 | | datetime | Enable the date and time coordinate support | chrono | Yes | |
|---|
| 716 | |
|---|
| 717 | - Element, series and util functions |
|---|
| 718 | |
|---|
| 719 | | Name | Description | Additional Dependency |Default?| |
|---|
| 720 | |---------|--------------|--------|------------| |
|---|
| 721 | | errorbar | The errorbar element support | None | Yes | |
|---|
| 722 | | candlestick | The candlestick element support | None | Yes | |
|---|
| 723 | | boxplot | The boxplot element support | None | Yes | |
|---|
| 724 | | area\_series | The area series support | None | Yes | |
|---|
| 725 | | line\_series | The line series support | None | Yes | |
|---|
| 726 | | histogram | The histogram series support | None | Yes | |
|---|
| 727 | | point\_series| The point series support | None | Yes | |
|---|
| 728 | |
|---|
| 729 | - Misc |
|---|
| 730 | |
|---|
| 731 | | Name | Description | Additional Dependency |Default?| |
|---|
| 732 | |---------|--------------|--------|------------| |
|---|
| 733 | | deprecated\_items | This feature allows use of deprecated items which is going to be removed in the future | None | Yes | |
|---|
| 734 | | debug | Enable the code used for debugging | None | No | |
|---|
| 735 | |
|---|
| 736 | |
|---|
| 737 | ## FAQ List |
|---|
| 738 | |
|---|
| 739 | * Why does the WASM example break on my machine ? |
|---|
| 740 | |
|---|
| 741 | The WASM example requires using `wasm32` target to build. Using `cargo build` is likely to use the default target |
|---|
| 742 | which in most of the case is any of the x86 target. Thus you need add `--target=wasm32-unknown-unknown` in the cargo |
|---|
| 743 | parameter list to build it. |
|---|
| 744 | |
|---|
| 745 | * How to draw text/circle/point/rectangle/... on the top of chart ? |
|---|
| 746 | |
|---|
| 747 | As you may have realized, Plotters is a drawing library rather than a traditional data plotting library, |
|---|
| 748 | you have the freedom to draw anything you want on the drawing area. |
|---|
| 749 | Use `DrawingArea::draw` to draw any element on the drawing area. |
|---|
| 750 | |
|---|
| 751 | * Where can I find the backend code ? |
|---|
| 752 | |
|---|
| 753 | Since Plotters 0.3, all drawing backends are independent crate from the main Plotters crate. |
|---|
| 754 | Use the following link to find the backend code: |
|---|
| 755 | |
|---|
| 756 | - [Bitmap Backend](https://github.com/plotters-rs/plotters-bitmap.git) |
|---|
| 757 | - [SVG Backend](https://github.com/plotters-rs/plotters-svg.git) |
|---|
| 758 | - [HTML5 Canvas Backend](https://github.com/plotters-rs/plotters-canvas.git) |
|---|
| 759 | - [GTK/Cairo Backend](https://github.com/plotters-rs/plotters-cairo.git) |
|---|
| 760 | |
|---|
| 761 | * How to check if a backend writes to a file successfully ? |
|---|
| 762 | |
|---|
| 763 | The behavior of Plotters backend is consistent with the standard library. |
|---|
| 764 | When the backend instance is dropped, [`crate::drawing::DrawingArea::present()`] or `Backend::present()` is called automatically |
|---|
| 765 | whenever is needed. When the `present()` method is called from `drop`, any error will be silently ignored. |
|---|
| 766 | |
|---|
| 767 | In the case that error handling is important, you need manually call the `present()` method before the backend gets dropped. |
|---|
| 768 | For more information, please see the examples. |
|---|
| 769 | |
|---|
| 770 | |
|---|
| 771 | <style> |
|---|
| 772 | img { |
|---|
| 773 | display: block; |
|---|
| 774 | margin: 0 auto; |
|---|
| 775 | max-width: 500px; |
|---|
| 776 | } |
|---|
| 777 | .galleryItem { |
|---|
| 778 | width: 250px; |
|---|
| 779 | display: inline-block; |
|---|
| 780 | } |
|---|
| 781 | .galleryImg { |
|---|
| 782 | max-width: 100%; |
|---|
| 783 | } |
|---|
| 784 | .galleryText { |
|---|
| 785 | text-align: center; |
|---|
| 786 | } |
|---|
| 787 | </style> |
|---|
| 788 | |
|---|
| 789 | |
|---|
| 790 | */ |
|---|
| 791 | pub mod chart; |
|---|
| 792 | pub mod coord; |
|---|
| 793 | pub mod data; |
|---|
| 794 | pub mod drawing; |
|---|
| 795 | pub mod element; |
|---|
| 796 | pub mod series; |
|---|
| 797 | pub mod style; |
|---|
| 798 | |
|---|
| 799 | /// Evaluation Context for Rust. See [the evcxr crate](https://crates.io/crates/evcxr) for more information. |
|---|
| 800 | #[cfg (feature = "evcxr" )] |
|---|
| 801 | #[cfg_attr (doc_cfg, doc(cfg(feature = "evcxr" )))] |
|---|
| 802 | pub mod evcxr; |
|---|
| 803 | |
|---|
| 804 | #[cfg (test)] |
|---|
| 805 | pub use crate::drawing::{check_color, create_mocked_drawing_area}; |
|---|
| 806 | |
|---|
| 807 | /// The module imports the most commonly used types and modules in Plotters |
|---|
| 808 | pub mod prelude { |
|---|
| 809 | // Chart related types |
|---|
| 810 | pub use crate::chart::{ChartBuilder, ChartContext, LabelAreaPosition, SeriesLabelPosition}; |
|---|
| 811 | |
|---|
| 812 | // Coordinates |
|---|
| 813 | pub use crate::coord::{ |
|---|
| 814 | cartesian::Cartesian2d, |
|---|
| 815 | combinators::{ |
|---|
| 816 | make_partial_axis, BindKeyPointMethod, BindKeyPoints, BuildNestedCoord, GroupBy, |
|---|
| 817 | IntoLinspace, IntoLogRange, IntoPartialAxis, Linspace, LogCoord, LogScalable, |
|---|
| 818 | NestedRange, NestedValue, ToGroupByRange, |
|---|
| 819 | }, |
|---|
| 820 | ranged1d::{DiscreteRanged, IntoSegmentedCoord, Ranged, SegmentValue}, |
|---|
| 821 | CoordTranslate, |
|---|
| 822 | }; |
|---|
| 823 | |
|---|
| 824 | #[allow (deprecated)] |
|---|
| 825 | pub use crate::coord::combinators::LogRange; |
|---|
| 826 | |
|---|
| 827 | #[cfg (feature = "chrono" )] |
|---|
| 828 | #[cfg_attr (doc_cfg, doc(cfg(feature = "chrono" )))] |
|---|
| 829 | pub use crate::coord::types::{ |
|---|
| 830 | IntoMonthly, IntoYearly, RangedDate, RangedDateTime, RangedDuration, |
|---|
| 831 | }; |
|---|
| 832 | |
|---|
| 833 | // Re-export the backend for backward compatibility |
|---|
| 834 | pub use plotters_backend::DrawingBackend; |
|---|
| 835 | |
|---|
| 836 | pub use crate::drawing::*; |
|---|
| 837 | |
|---|
| 838 | // Series helpers |
|---|
| 839 | #[cfg (feature = "area_series" )] |
|---|
| 840 | #[cfg_attr (doc_cfg, doc(cfg(feature = "area_series" )))] |
|---|
| 841 | pub use crate::series::AreaSeries; |
|---|
| 842 | #[cfg (feature = "histogram" )] |
|---|
| 843 | #[cfg_attr (doc_cfg, doc(cfg(feature = "histogram" )))] |
|---|
| 844 | pub use crate::series::Histogram; |
|---|
| 845 | #[cfg (feature = "point_series" )] |
|---|
| 846 | #[cfg_attr (doc_cfg, doc(cfg(feature = "point_series" )))] |
|---|
| 847 | pub use crate::series::PointSeries; |
|---|
| 848 | #[cfg (feature = "surface_series" )] |
|---|
| 849 | #[cfg_attr (doc_cfg, doc(cfg(feature = "surface_series" )))] |
|---|
| 850 | pub use crate::series::SurfaceSeries; |
|---|
| 851 | #[cfg (feature = "line_series" )] |
|---|
| 852 | #[cfg_attr (doc_cfg, doc(cfg(feature = "line_series" )))] |
|---|
| 853 | pub use crate::series::{DashedLineSeries, DottedLineSeries, LineSeries}; |
|---|
| 854 | |
|---|
| 855 | // Styles |
|---|
| 856 | pub use crate::style::{BLACK, BLUE, CYAN, GREEN, MAGENTA, RED, TRANSPARENT, WHITE, YELLOW}; |
|---|
| 857 | |
|---|
| 858 | #[cfg (feature = "full_palette" )] |
|---|
| 859 | #[cfg_attr (doc_cfg, doc(cfg(feature = "full_palette" )))] |
|---|
| 860 | pub use crate::style::full_palette; |
|---|
| 861 | |
|---|
| 862 | #[cfg (feature = "colormaps" )] |
|---|
| 863 | #[cfg_attr (doc_cfg, doc(cfg(feature = "colormaps" )))] |
|---|
| 864 | pub use crate::style::colors::colormaps::*; |
|---|
| 865 | |
|---|
| 866 | pub use crate::style::{ |
|---|
| 867 | AsRelative, Color, FontDesc, FontFamily, FontStyle, FontTransform, HSLColor, IntoFont, |
|---|
| 868 | IntoTextStyle, Palette, Palette100, Palette99, Palette9999, PaletteColor, RGBAColor, |
|---|
| 869 | RGBColor, ShapeStyle, TextStyle, |
|---|
| 870 | }; |
|---|
| 871 | |
|---|
| 872 | // Elements |
|---|
| 873 | pub use crate::element::{ |
|---|
| 874 | Circle, Cross, Cubiod, DynElement, EmptyElement, IntoDynElement, MultiLineText, |
|---|
| 875 | PathElement, Pie, Pixel, Polygon, Rectangle, Text, TriangleMarker, |
|---|
| 876 | }; |
|---|
| 877 | |
|---|
| 878 | #[cfg (feature = "boxplot" )] |
|---|
| 879 | #[cfg_attr (doc_cfg, doc(cfg(feature = "boxplot" )))] |
|---|
| 880 | pub use crate::element::Boxplot; |
|---|
| 881 | #[cfg (feature = "candlestick" )] |
|---|
| 882 | #[cfg_attr (doc_cfg, doc(cfg(feature = "candlestick" )))] |
|---|
| 883 | pub use crate::element::CandleStick; |
|---|
| 884 | #[cfg (feature = "errorbar" )] |
|---|
| 885 | #[cfg_attr (doc_cfg, doc(cfg(feature = "errorbar" )))] |
|---|
| 886 | pub use crate::element::ErrorBar; |
|---|
| 887 | |
|---|
| 888 | #[cfg (feature = "bitmap_backend" )] |
|---|
| 889 | #[cfg_attr (doc_cfg, doc(cfg(feature = "bitmap_backend" )))] |
|---|
| 890 | pub use crate::element::BitMapElement; |
|---|
| 891 | |
|---|
| 892 | // Data |
|---|
| 893 | pub use crate::data::Quartiles; |
|---|
| 894 | |
|---|
| 895 | // TODO: This should be deprecated and completely removed |
|---|
| 896 | #[cfg (feature = "deprecated_items" )] |
|---|
| 897 | #[cfg_attr (doc_cfg, doc(cfg(feature = "deprecated_items" )))] |
|---|
| 898 | #[allow (deprecated)] |
|---|
| 899 | pub use crate::element::Path; |
|---|
| 900 | |
|---|
| 901 | #[allow (type_alias_bounds)] |
|---|
| 902 | /// The type used to returns a drawing operation that can be failed |
|---|
| 903 | /// - `T`: The return type |
|---|
| 904 | /// - `D`: The drawing backend type |
|---|
| 905 | pub type DrawResult<T, D: DrawingBackend> = |
|---|
| 906 | Result<T, crate::drawing::DrawingAreaErrorKind<D::ErrorType>>; |
|---|
| 907 | |
|---|
| 908 | #[cfg (feature = "evcxr" )] |
|---|
| 909 | #[cfg_attr (doc_cfg, doc(cfg(feature = "evcxr" )))] |
|---|
| 910 | pub use crate::evcxr::evcxr_figure; |
|---|
| 911 | |
|---|
| 912 | // Re-export tier 1 backends for backward compatibility |
|---|
| 913 | #[cfg (feature = "bitmap_backend" )] |
|---|
| 914 | #[cfg_attr (doc_cfg, doc(cfg(feature = "bitmap_backend" )))] |
|---|
| 915 | pub use plotters_bitmap::BitMapBackend; |
|---|
| 916 | |
|---|
| 917 | #[cfg (feature = "svg_backend" )] |
|---|
| 918 | #[cfg_attr (doc_cfg, doc(cfg(feature = "svg_backend" )))] |
|---|
| 919 | pub use plotters_svg::SVGBackend; |
|---|
| 920 | } |
|---|
| 921 | |
|---|
| 922 | /// This module contains some useful re-export of backend related types. |
|---|
| 923 | pub mod backend { |
|---|
| 924 | pub use plotters_backend::DrawingBackend; |
|---|
| 925 | #[cfg (feature = "bitmap_backend" )] |
|---|
| 926 | #[cfg_attr (doc_cfg, doc(cfg(feature = "bitmap_backend" )))] |
|---|
| 927 | pub use plotters_bitmap::{ |
|---|
| 928 | bitmap_pixel::{BGRXPixel, PixelFormat, RGBPixel}, |
|---|
| 929 | BitMapBackend, |
|---|
| 930 | }; |
|---|
| 931 | #[cfg (feature = "svg_backend" )] |
|---|
| 932 | #[cfg_attr (doc_cfg, doc(cfg(feature = "svg_backend" )))] |
|---|
| 933 | pub use plotters_svg::SVGBackend; |
|---|
| 934 | } |
|---|
| 935 | |
|---|
| 936 | #[cfg (test)] |
|---|
| 937 | mod test; |
|---|
| 938 | |
|---|
